🖼️AI Image
GPT-Image-2 Example · Empirical Scaling Laws Diagram
A reference case for GPT-Image-2, selected from the "Research Paper Illustrations" showcase, suitable for retrieving generative effects in the direction of "Empirical Scaling Laws Diagram."
Author: AI Plus Lab
✦Results
◌Case Background
来自 GPT-Image2-Skill README 的精选展示条目,适合作为“研究论文图示 / 经验缩放规律图”方向的站内参考案例。
⌘Prompt Content
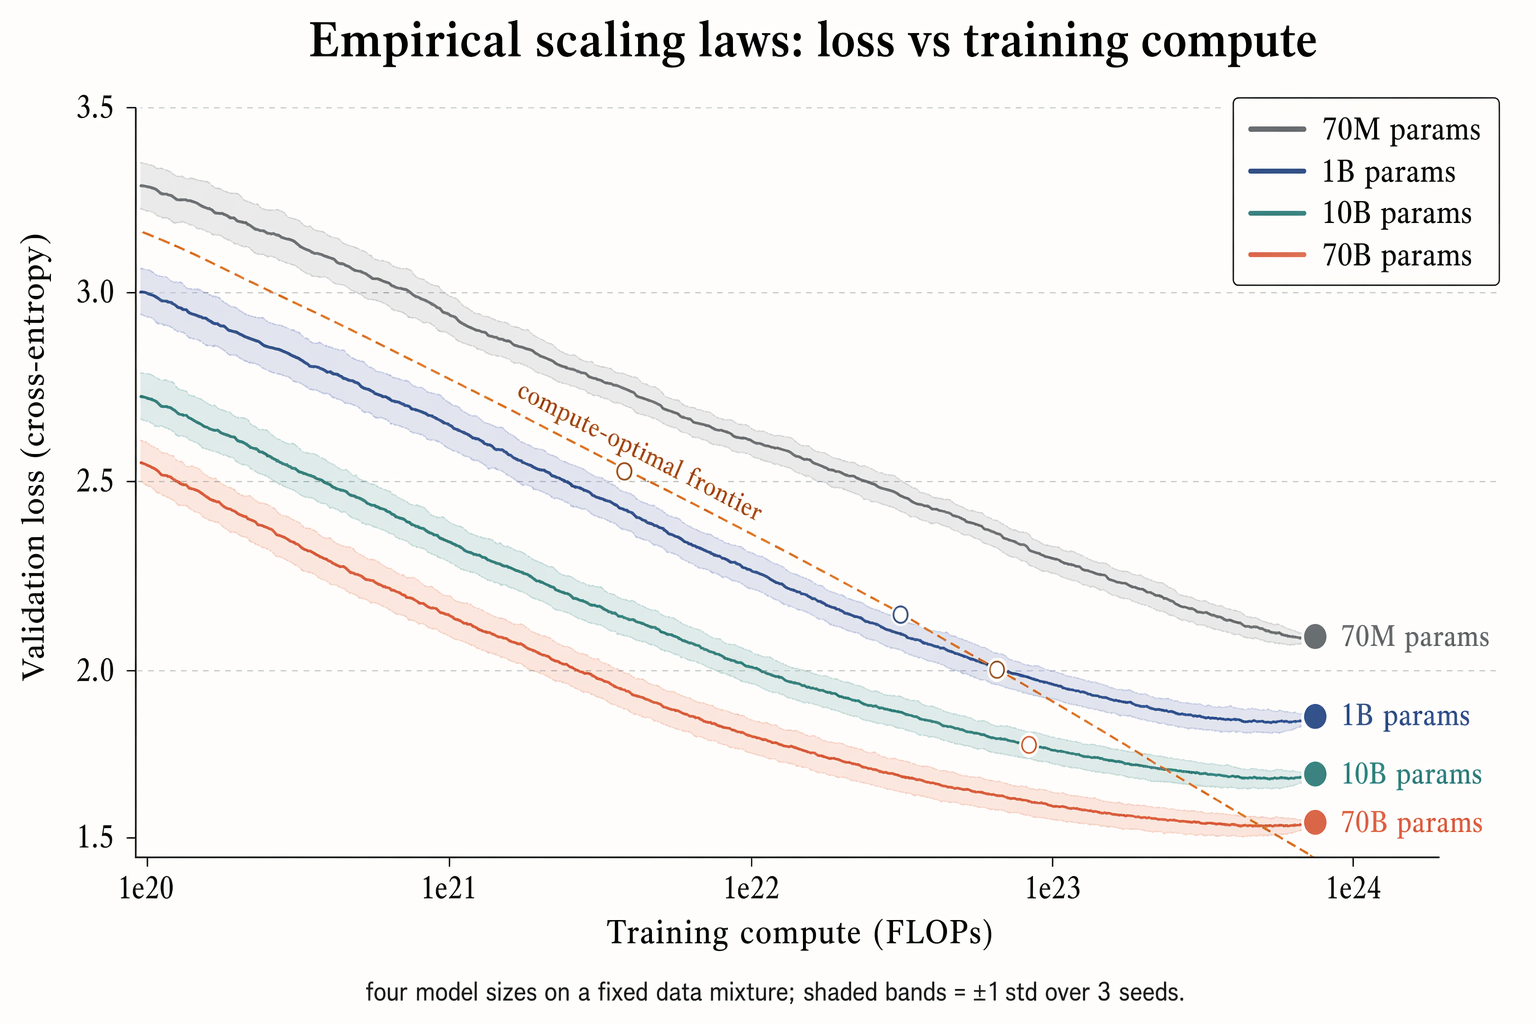
Horizontal 16:9 logarithmic scale chart of training loss vs compute, featuring four curves for different model scales.

X-axis labeled "Training compute (FLOPs)" with logarithmic markers "1e20," "1e21," "1e22," "1e23," "1e24." Y-axis labeled "Validation loss (cross-entropy)" with linear decreasing markers "3.5," "3.0," "2.5," "2.0," "1.5."

Four descending curves with ±1σ shadow bands, near tails labeled:
"70M params" (slate gray), "1B params" (soft navy), "10B params" (dusty turquoise), "70B params" (soft terracotta).

Warm copper dashed diagonal labeled "compute-optimal frontier" with hollow circles at equal compute crossing points. Legend box in the top right corner.

Title: "Empirical scaling laws: loss vs training compute." Subtitle: "Four model scales using fixed data mixing; shadow bands represent ±1 standard deviation of three experiments."
✎Outcome Notes
This case has been migrated from GPT-Image2-Skill README to AIPlusLab `/prompts` for convenient retrieval, browsing, and reuse within the site.