🖼️AI Image
GPT-Image-2 Case Study · Ablation Bar Chart with Error Bars
A reference case from the GPT-Image-2 selection of 'Research Paper Illustrations', suitable for exploring the generated effects in the direction of 'Ablation Bar Chart with Error Bars'.
Author: AI Plus Lab
✦Results
◌Case Background
来自 GPT-Image2-Skill README 的精选展示条目,适合作为“研究论文图示 / 带误差条的消融柱状图”方向的站内参考案例。
⌘Prompt Content
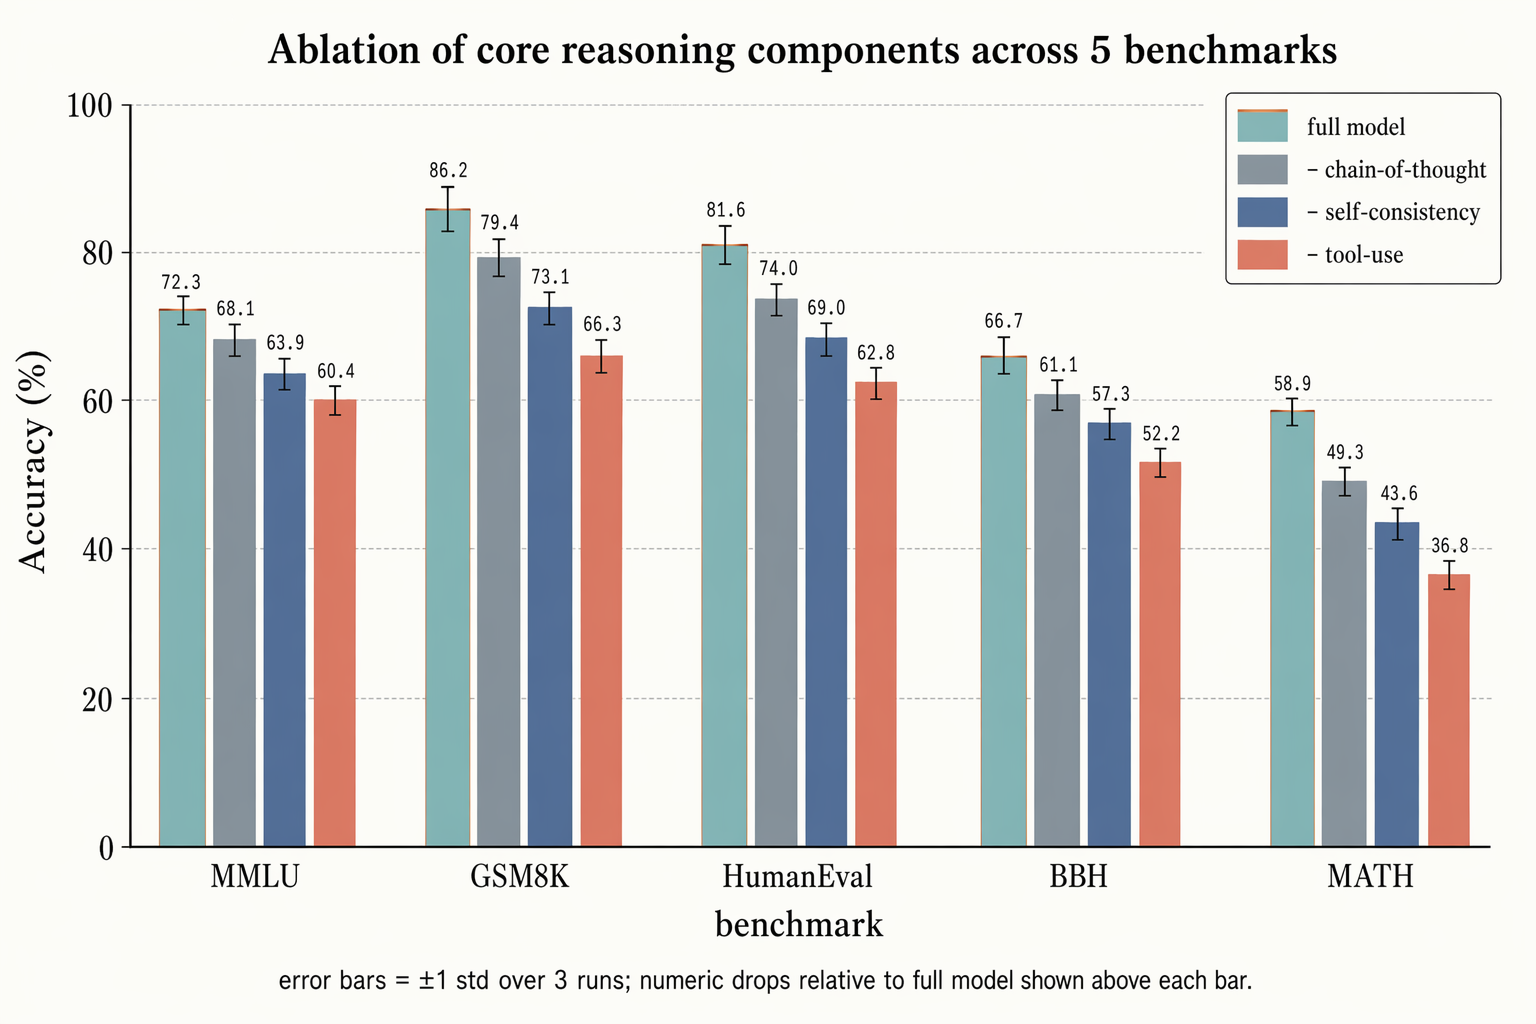
Horizontal 16:9 grouped ablation bar chart.

X-axis: 5 benchmark groups "MMLU", "GSM8K", "HumanEval", "BBH", "MATH". Y-axis "Accuracy (%)", scales "0", "20", "40", "60", "80", "100".

Each group contains 4 adjacent bars:
(1) "full model" — dust teal, with a thin warm copper border at the top
(2) "– chain-of-thought" — slate gray
(3) "– self-consistency" — soft navy blue
(4) "– tool-use" — soft terra cotta

Each bar has a thin black ±1σ error bar at the top; above is a monospaced numeric label. Light horizontal grid lines. Legend box in the upper right corner.

Title: "Ablation of core reasoning components across 5 benchmarks". Subtitle: "Error bars represent ±1 standard deviation from three runs; numeric label at the top of each bar shows the decline relative to the full model".
✎Outcome Notes
This case has been migrated from the GPT-Image2-Skill README to AIPlusLab `/prompts`, facilitating direct retrieval, browsing, and reuse within the site.