🖼️AI Image
GPT-Image-2 Case Study · SaaS Operations Dashboard
Showcases the capabilities of GPT-Image-2 in dashboard layout, metric labeling, and information density.
Author: AI Plus Lab
✦Results
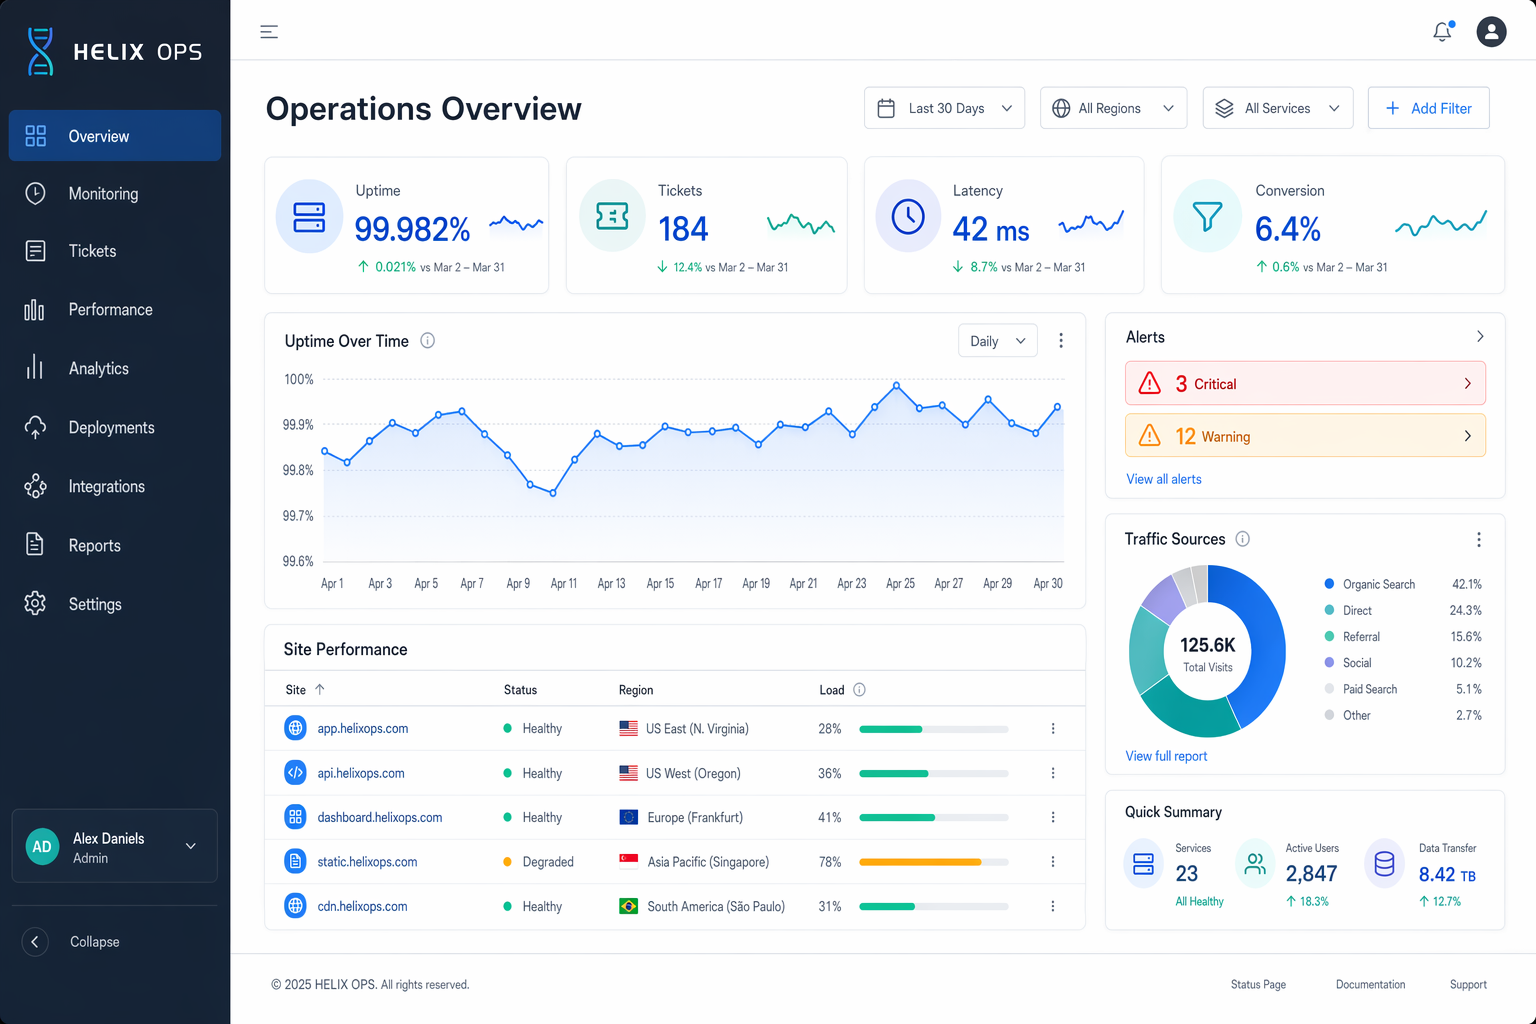
◌Case Background
桌面 dashboard 属于对信息组织要求很高的 UI 场景,比普通视觉海报更能体现模型在结构化 UI 生成上的上限。
⌘Prompt Content
Create a high-end desktop SaaS analytics dashboard mockup for a fictional platform named HELIX OPS, displayed on a 16:10 monitor canvas at 1600x1000. Use a cool palette of slate, cobalt blue, teal, pale gray, and white, with subtle glass panels and tight grid alignment. The layout should include a left sidebar, top filter bar, KPI cards, line charts, data table, and alert panel. Use crisp typography and correct labels. Include in-image text: "HELIX OPS", "Operations Overview", "Last 30 Days", "Uptime 99.982%", "Tickets 184", "Latency 42 ms", and "Conversion 6.4%". Show a line chart labeled "Apr 1" through "Apr 30", a donut chart titled "Traffic Sources", and a table with columns "Site", "Status", "Region", and "Load". Add alert pills reading "3 Critical" and "12 Warning". Composition should feel realistic and presentation-ready, with clean hierarchy, precise spacing, balanced negative space, and ultra-sharp dashboard UI rendering.
✎Outcome Notes
For user searches, such a case study can be categorized under multiple dimensions like `UI / Dashboard / SaaS / GPT-Image-2`, perfectly fitting your desired multi-dimensional classification structure.